An article published 2 September in Hart Energy’s E&P discussed how 3D CSEM (controlled-source electromagnetic) data can be used to map salt bodies; and improve velocity models and seismic imaging in a traditionally difficult environment.
The article “Coming to terms with subsalt” has implications for exploration in areas of the world which have seen subsalt discoveries, like offshore Brazil, the Gulf of Mexico and Africa.
The article’s author, Peyman Moghaddam, explained that electromagnetic methods are well-suited to image the base of salt and subsalt sediment structures.
Changing prospectivity of the salt flank
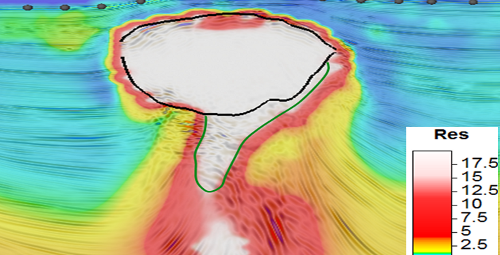
The following illustration shows results from a deepwater, 3D CSEM survey performed by EMGS in the Gulf of Mexico.
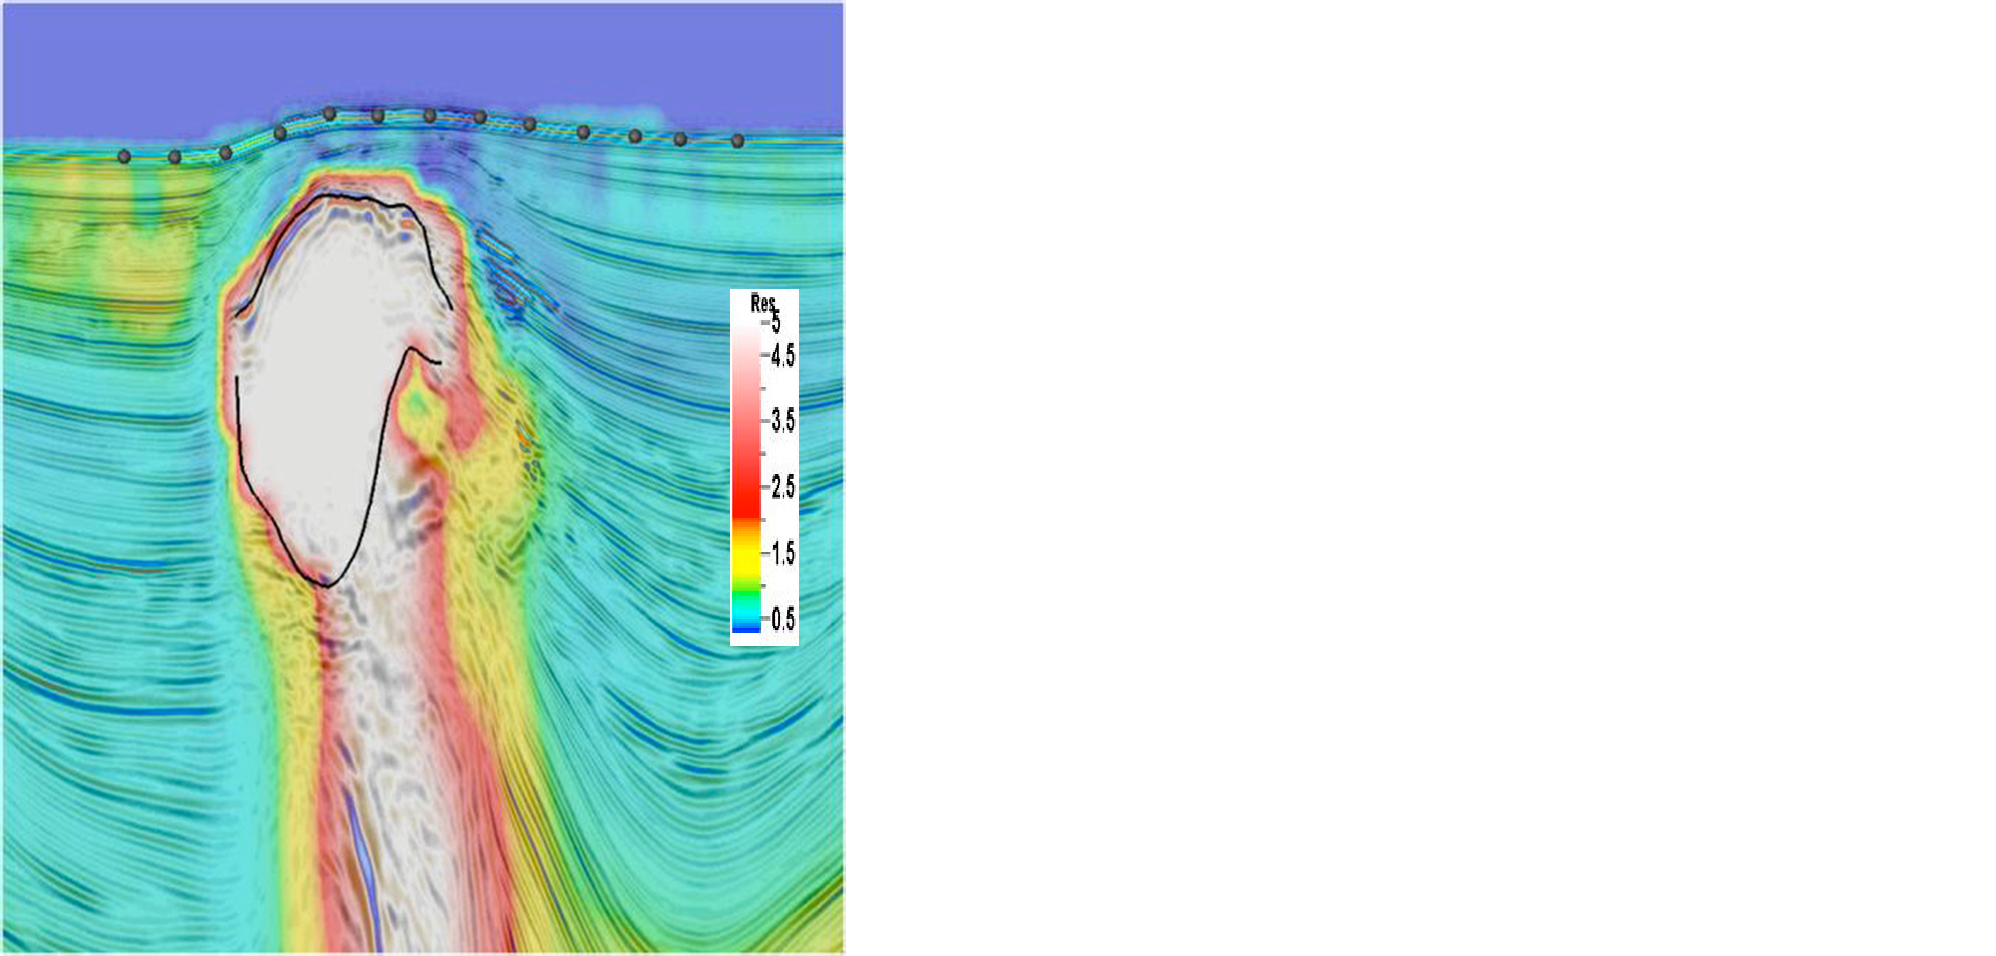
The survey targeted a salt diaper with potential hydrocarbon reservoirs at the flanks. Seismic data already established the approximate location of the salt diapirs. However, there was a need to identify AVO responses and improve the interpretation of the salt flank and the base of salt